Week one on Cloudflare Pages: 449 visitors, 5.99% cached
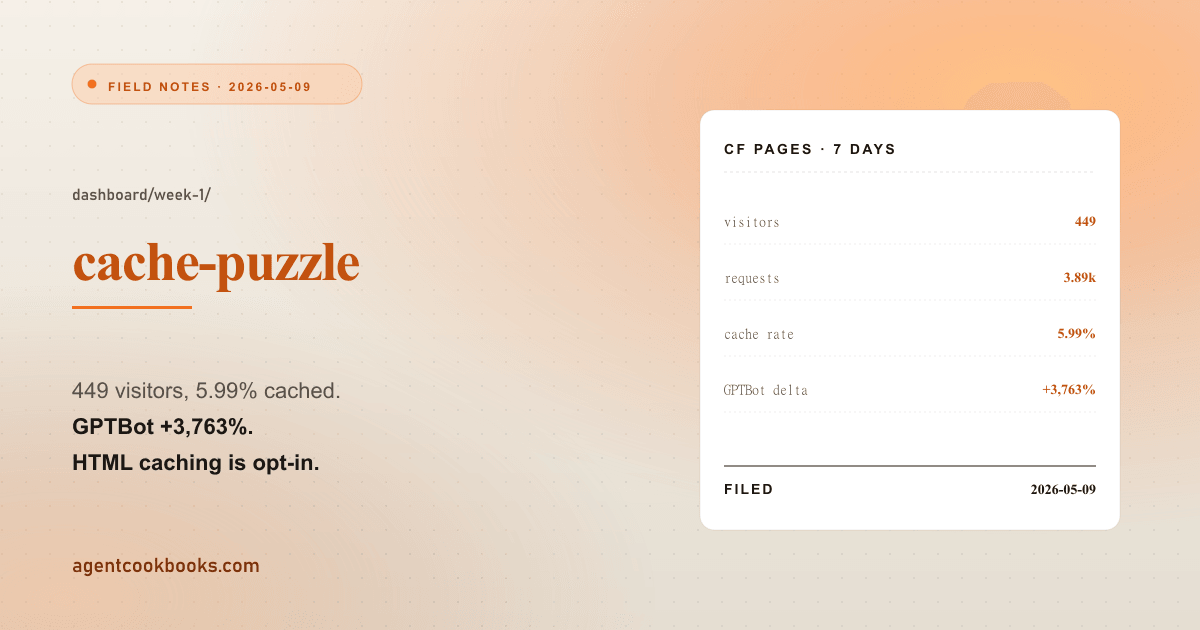
The custom domain attached on April 30. Seven days later, the Cloudflare Pages dashboard showed 449 unique visitors, 3.89k requests, 5.99% cache rate, 24 MB egress. Three of those numbers tell a clean story; the fourth — 5.99% cache rate — looked broken for a static Astro site that should be cache-friendly out of the box. The visitor count was real-user dominant but the request count was not: a single GPTBot full-site sweep landed inside the window (425 hits in 24 hours, +3,763% vs the prior period) and re-shaped the country distribution toward bot-datacenter geographies. This is the week-one read, with three ranked hypotheses on the cache puzzle, one already confirmed at the four-day mark, and a note on which numbers in a static-site CF dashboard are signal and which are noise. The cache-rate puzzle resolves later in a follow-up — the short version: Cloudflare Pages ignores Cache-Control for HTML at the edge unless you also create an explicit Cache Rule in the zone dashboard.
What I ran
No additional tooling beyond what Cloudflare Pages emits by default. Two screenshots from the dashboard’s seven-day rolling window (April 25 – May 2): top-line metrics, country breakdown, hourly curve. The site itself: Astro 6 static output, Pagefind 1.5.x for search, hosted on Cloudflare Pages with a public/_headers file shipping HSTS / CSP / X-Frame-Options: DENY / Permissions-Policy — the CSP rationale and the two undocumented Pagefind directives are written up in A static-site CSP that doesn’t break Pagefind. No analytics SDK, no third-party JS. Whatever shows up in the CF dashboard is the only telemetry.
What happened
Top-line for the week:
| Metric | Value |
|---|---|
| Unique visitors | 449 |
| Total requests | 3.89k |
| Percent cached | 5.99% |
| Total data served | 24 MB |
| Requests per visitor | 8.7 |
| Average response size | ~6.2 KB |
The curve shape is the cleanest signal in the data. Essentially flat at zero for the four days before the custom domain attached, ramps on April 29, peaks May 1 at ~190 visitors / ~1.5k requests / ~10 MB, slight decay May 2 (~210 visitors, still elevated). Three operational events line up precisely with the three inflection points:
- Apr 25–28 flatline: still serving from
agentcookbooks.pages.devonly. The Cloudflare Pages middleware was emittingX-Robots-Tag: noindex, nofollowon*.pages.devhosts; Search Console had no sitemap. Traffic was effectively zero by design. - Apr 30 ramp: custom domain attached, sitemap submitted to GSC (Success status, crawl pending),
pages.devmiddleware swapped from noindex to 301-to-canonical. - May 1 peak: first day with both indexing pickup and the Cloudflare AI Audit / robots.txt fix landed. Live
/robots.txtbyte-for-byte matched the repo file.
8.7 requests per unique visitor is healthy session depth — visitors clicking through the wiki via topic chips and Pagefind search, not bouncing on first page. ~6.2 KB per response says Astro static + Pagefind is genuinely lean. No surprise spikes.
The geographic mix needs one discount factor to read accurately: the operator’s own dev/preview hits show up in the country column. After subtracting them, the ~204 estimated external visitors per week is the real-reader baseline. Headline number is roughly twice the actual baseline; useful to know going in.
Where it drifted
5.99% cache rate is the puzzle. Static sites on a CDN should be cache-friendly out of the box. Three hypotheses on day one, ranked by likelihood:
- Cold-start dominant. ~165 unique URLs (153 skill pages + 6 blog posts + indexes), most being requested for the first time. Self-resolves as the corpus gets indexed and crawler traffic fills the cache.
- Bot-heavy traffic. GoogleBot + the AI crawlers explicitly allowed via
public/robots.txt(ChatGPT-User, PerplexityBot, ClaudeBot, etc.) request unique URLs in sequence and bypass cache by design. - Header config gap. Cloudflare Pages doesn’t set aggressive
Cache-Controlon HTML by default. If response headers say something likeCache-Control: public, max-age=0, must-revalidate, every request is a revalidate cycle that may not count as “cached” in the dashboard’s accounting.
Four days later, option 3 was the answer. Cloudflare’s cache panel showed ~451 Dynamic responses against ~51 Hit + Revalidated (~10% effective cache, marginally up from 5.99%). For Cloudflare Pages, HTML is treated as Dynamic by default — the CDN won’t cache it without an explicit rule. Two paths to fix:
- Add a Cache Rule in the CF dashboard:
*.agentcookbooks.com/*→Cache Everything, edge TTL 1h, browser TTL 5m. - Or set
Cache-Control: public, max-age=300, s-maxage=3600on HTML inpublic/_headers.
Both are free CDN performance for a static site. Open work, not yet shipped.
The second drift was reading bot traffic as human. Around the same four-day mark, Cloudflare’s bot panel showed GPTBot crawled 425 requests in 24 hours, +3,763% over the prior period. Full-site sweep of 229 built pages plus repeat sitemap fetches. The pattern, traced backward through the dashboard:
- Deploy push → Googlebot spike (+406% earlier in the week).
- Googlebot reindexes
/sitemap.xml. - GPTBot follows the freshly-indexed sitemap a few hours later.
- ClaudeBot stays at 5–10/day (Anthropic’s normal slow-and-polite pace).
Real-user traffic was holding ~150–200/day at that point. Bot and scanner noise was meaningfully shaping the headline counts. Worth knowing on a dashboard with no bot/human split surfaced by default — the 4xx column on a static site is almost entirely WordPress scanners probing /wp-login.php and /xmlrpc.php, the country mix tilts toward bot datacenters, the cache rate gets dragged down by crawlers requesting unique URLs.
What I’d change
Three things, in order of leverage.
Add the HTML cache rule. This is the highest-ROI move on the list and the only one that’s definitely worth doing. Five-line addition to public/_headers or a single dashboard rule. Free CDN performance.
Re-check AI search citations at the four-week mark, not the one-week mark. AI search citations land 1–4 weeks post-crawl. Querying ChatGPT or Perplexity for site mentions a week after launch is too early to read signal. Re-check around 2026-05-13 — the four-week window from the May 1 indexing peak.
Don’t read the headline number at face value. ~204 estimated external visitors after self-traffic discount, against a crawler population that nearly tripled the request count on its peak day, against a cache rate gated by a default that needs a one-line override. Each correction halves or doubles a number. Read four numbers together — visitors, requests, cache rate, bot share — and the picture is consistent. Read any single number and it’s misleading.
The full 30-day post lands once those three cycles play out. This is week one’s receipt: the curve fits the operations, the cache puzzle had a one-line explanation hiding in a default, and the bot share is doing more of the work than the dashboard’s top metrics suggest.